Fulfin

(01)

TL;DR

Collaborators

Aditya (UI/UX)

Sunaina (Project Manager)

Turning Data into Credit Signals

Fulfin is a German based digital financing partner for entrepreneurs, combining financing products with technology to speed up access to capital. The company evaluates potential through digital processes and open-banking data and connects applicants to suitable financing options.

Mission

Design a risk analytics dashboard and onboarding flow that helps Fulfin teams review cashflow, assess counterparties, and make financing decisions with confidence and speed.

Outcome

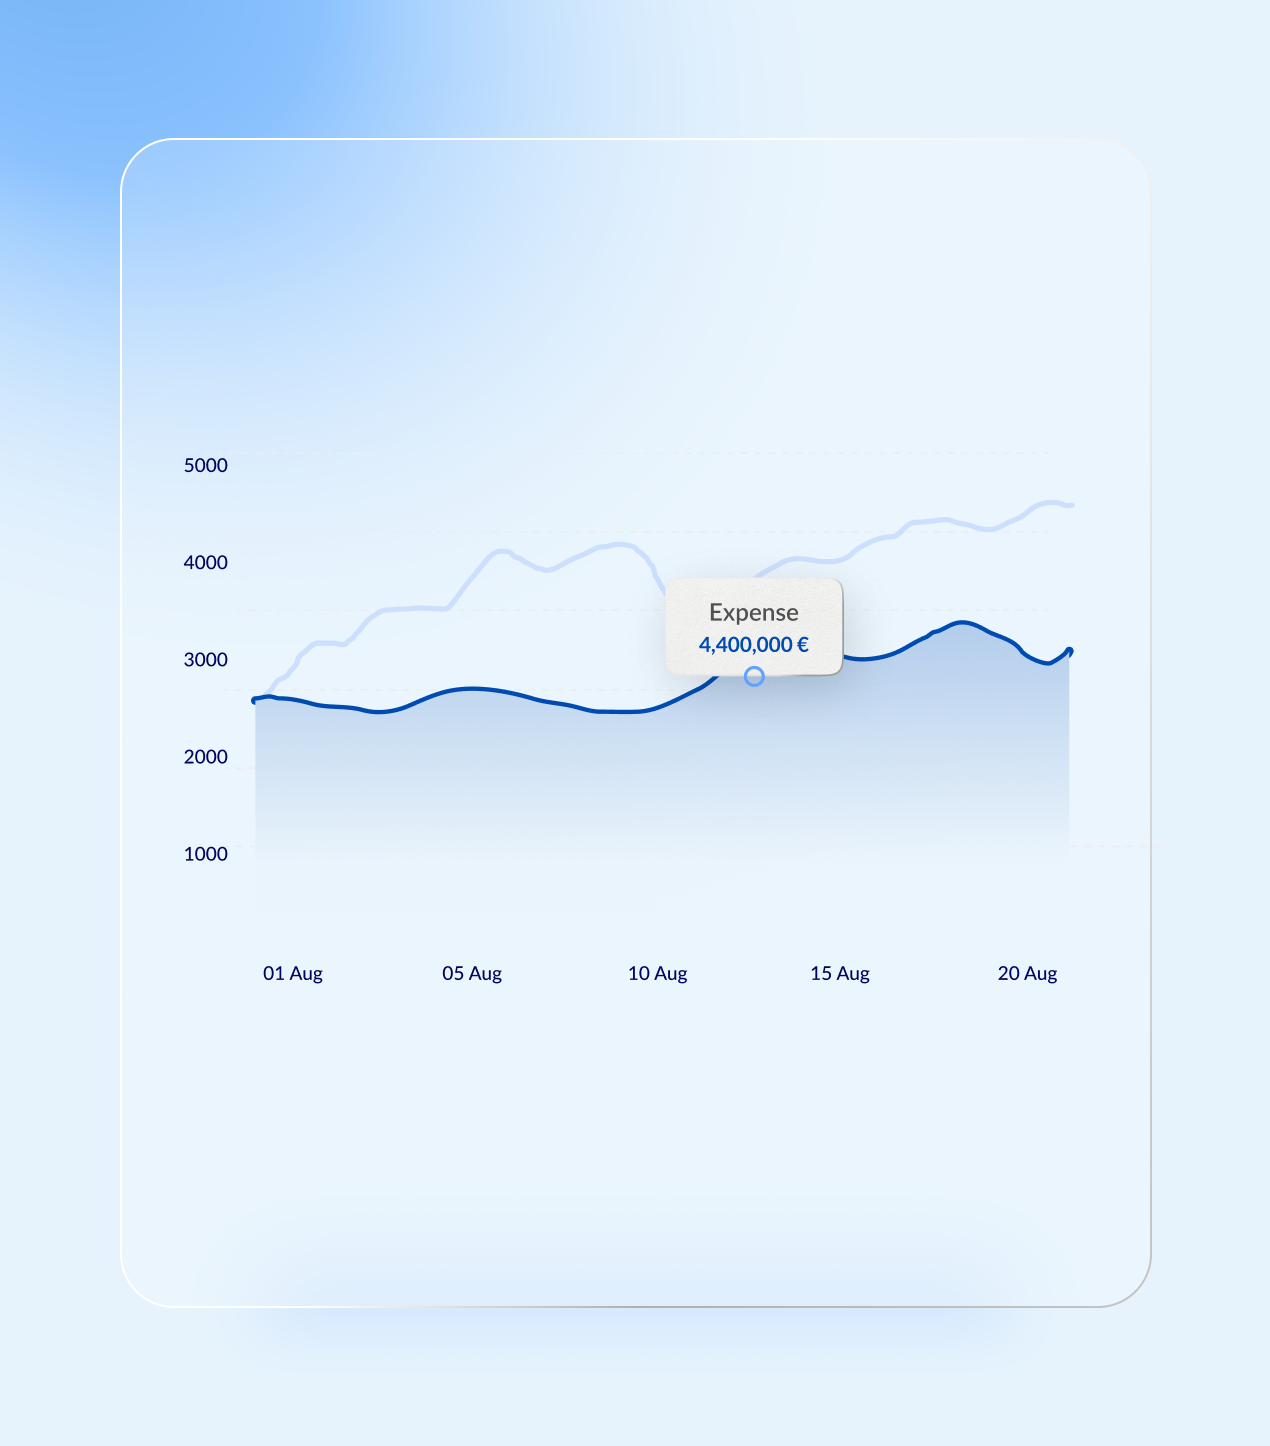
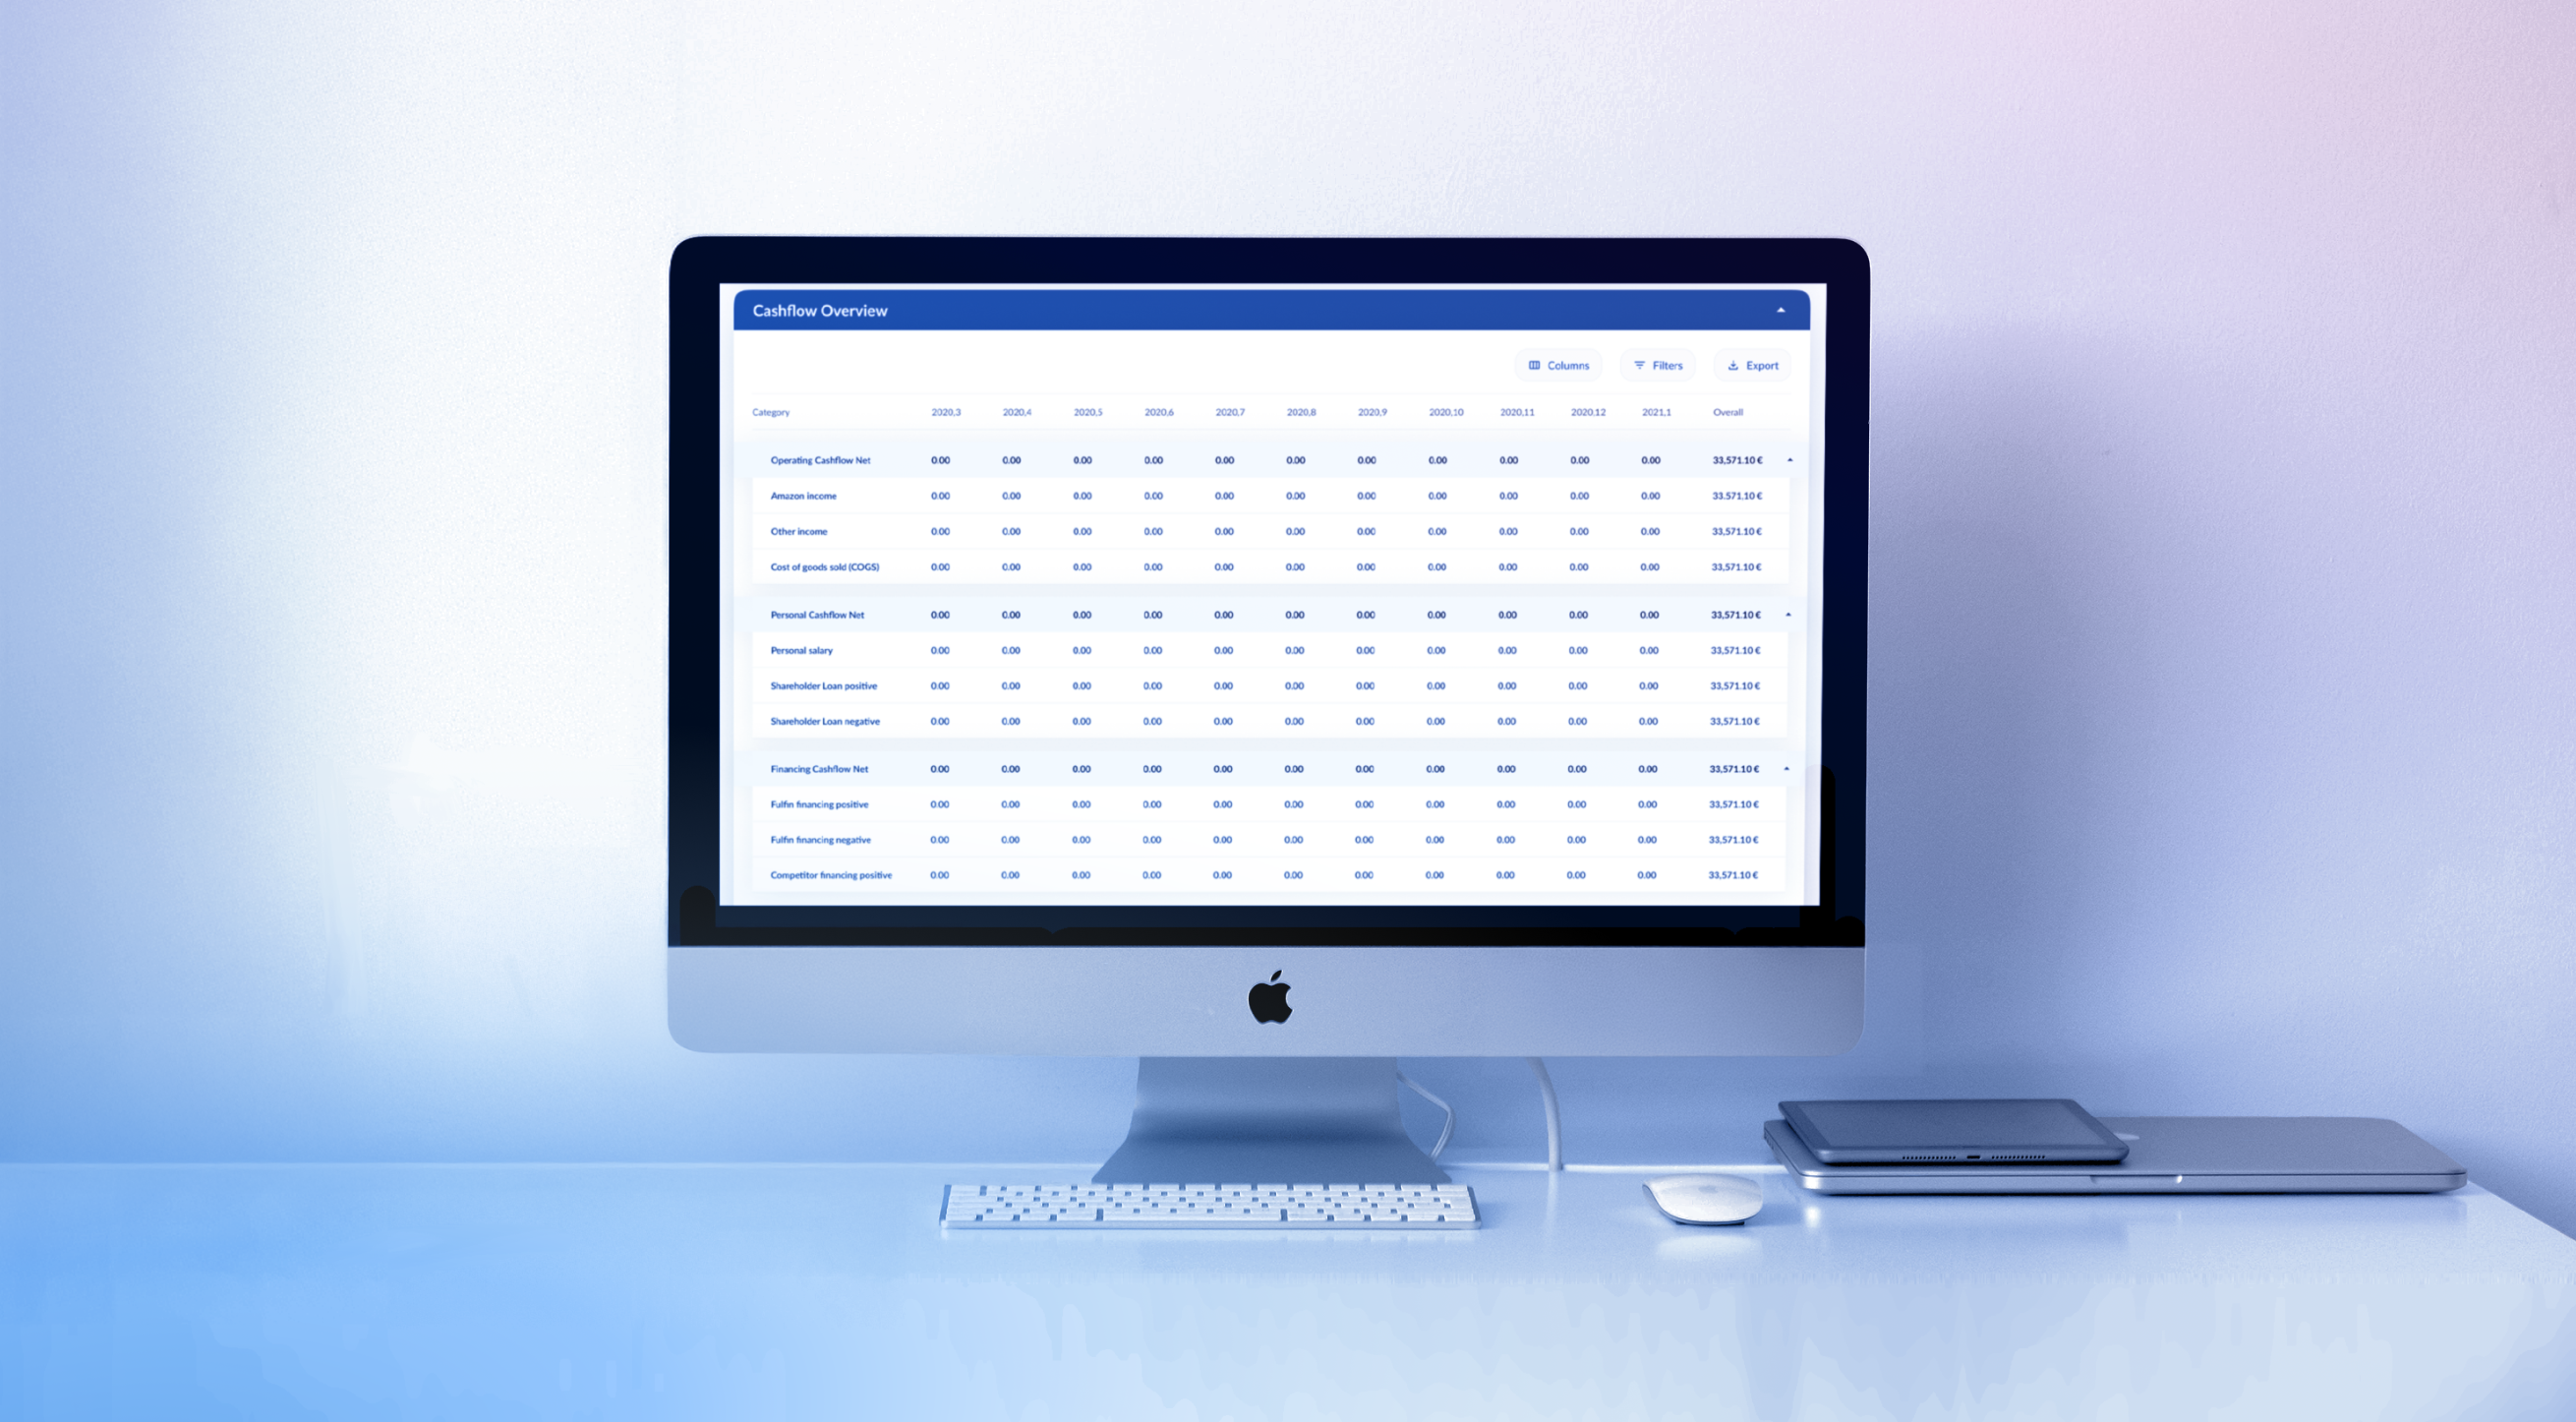
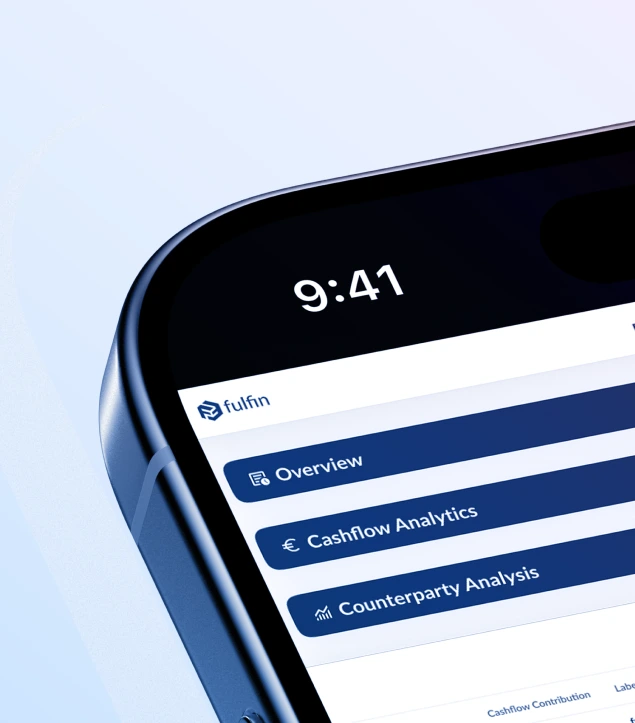
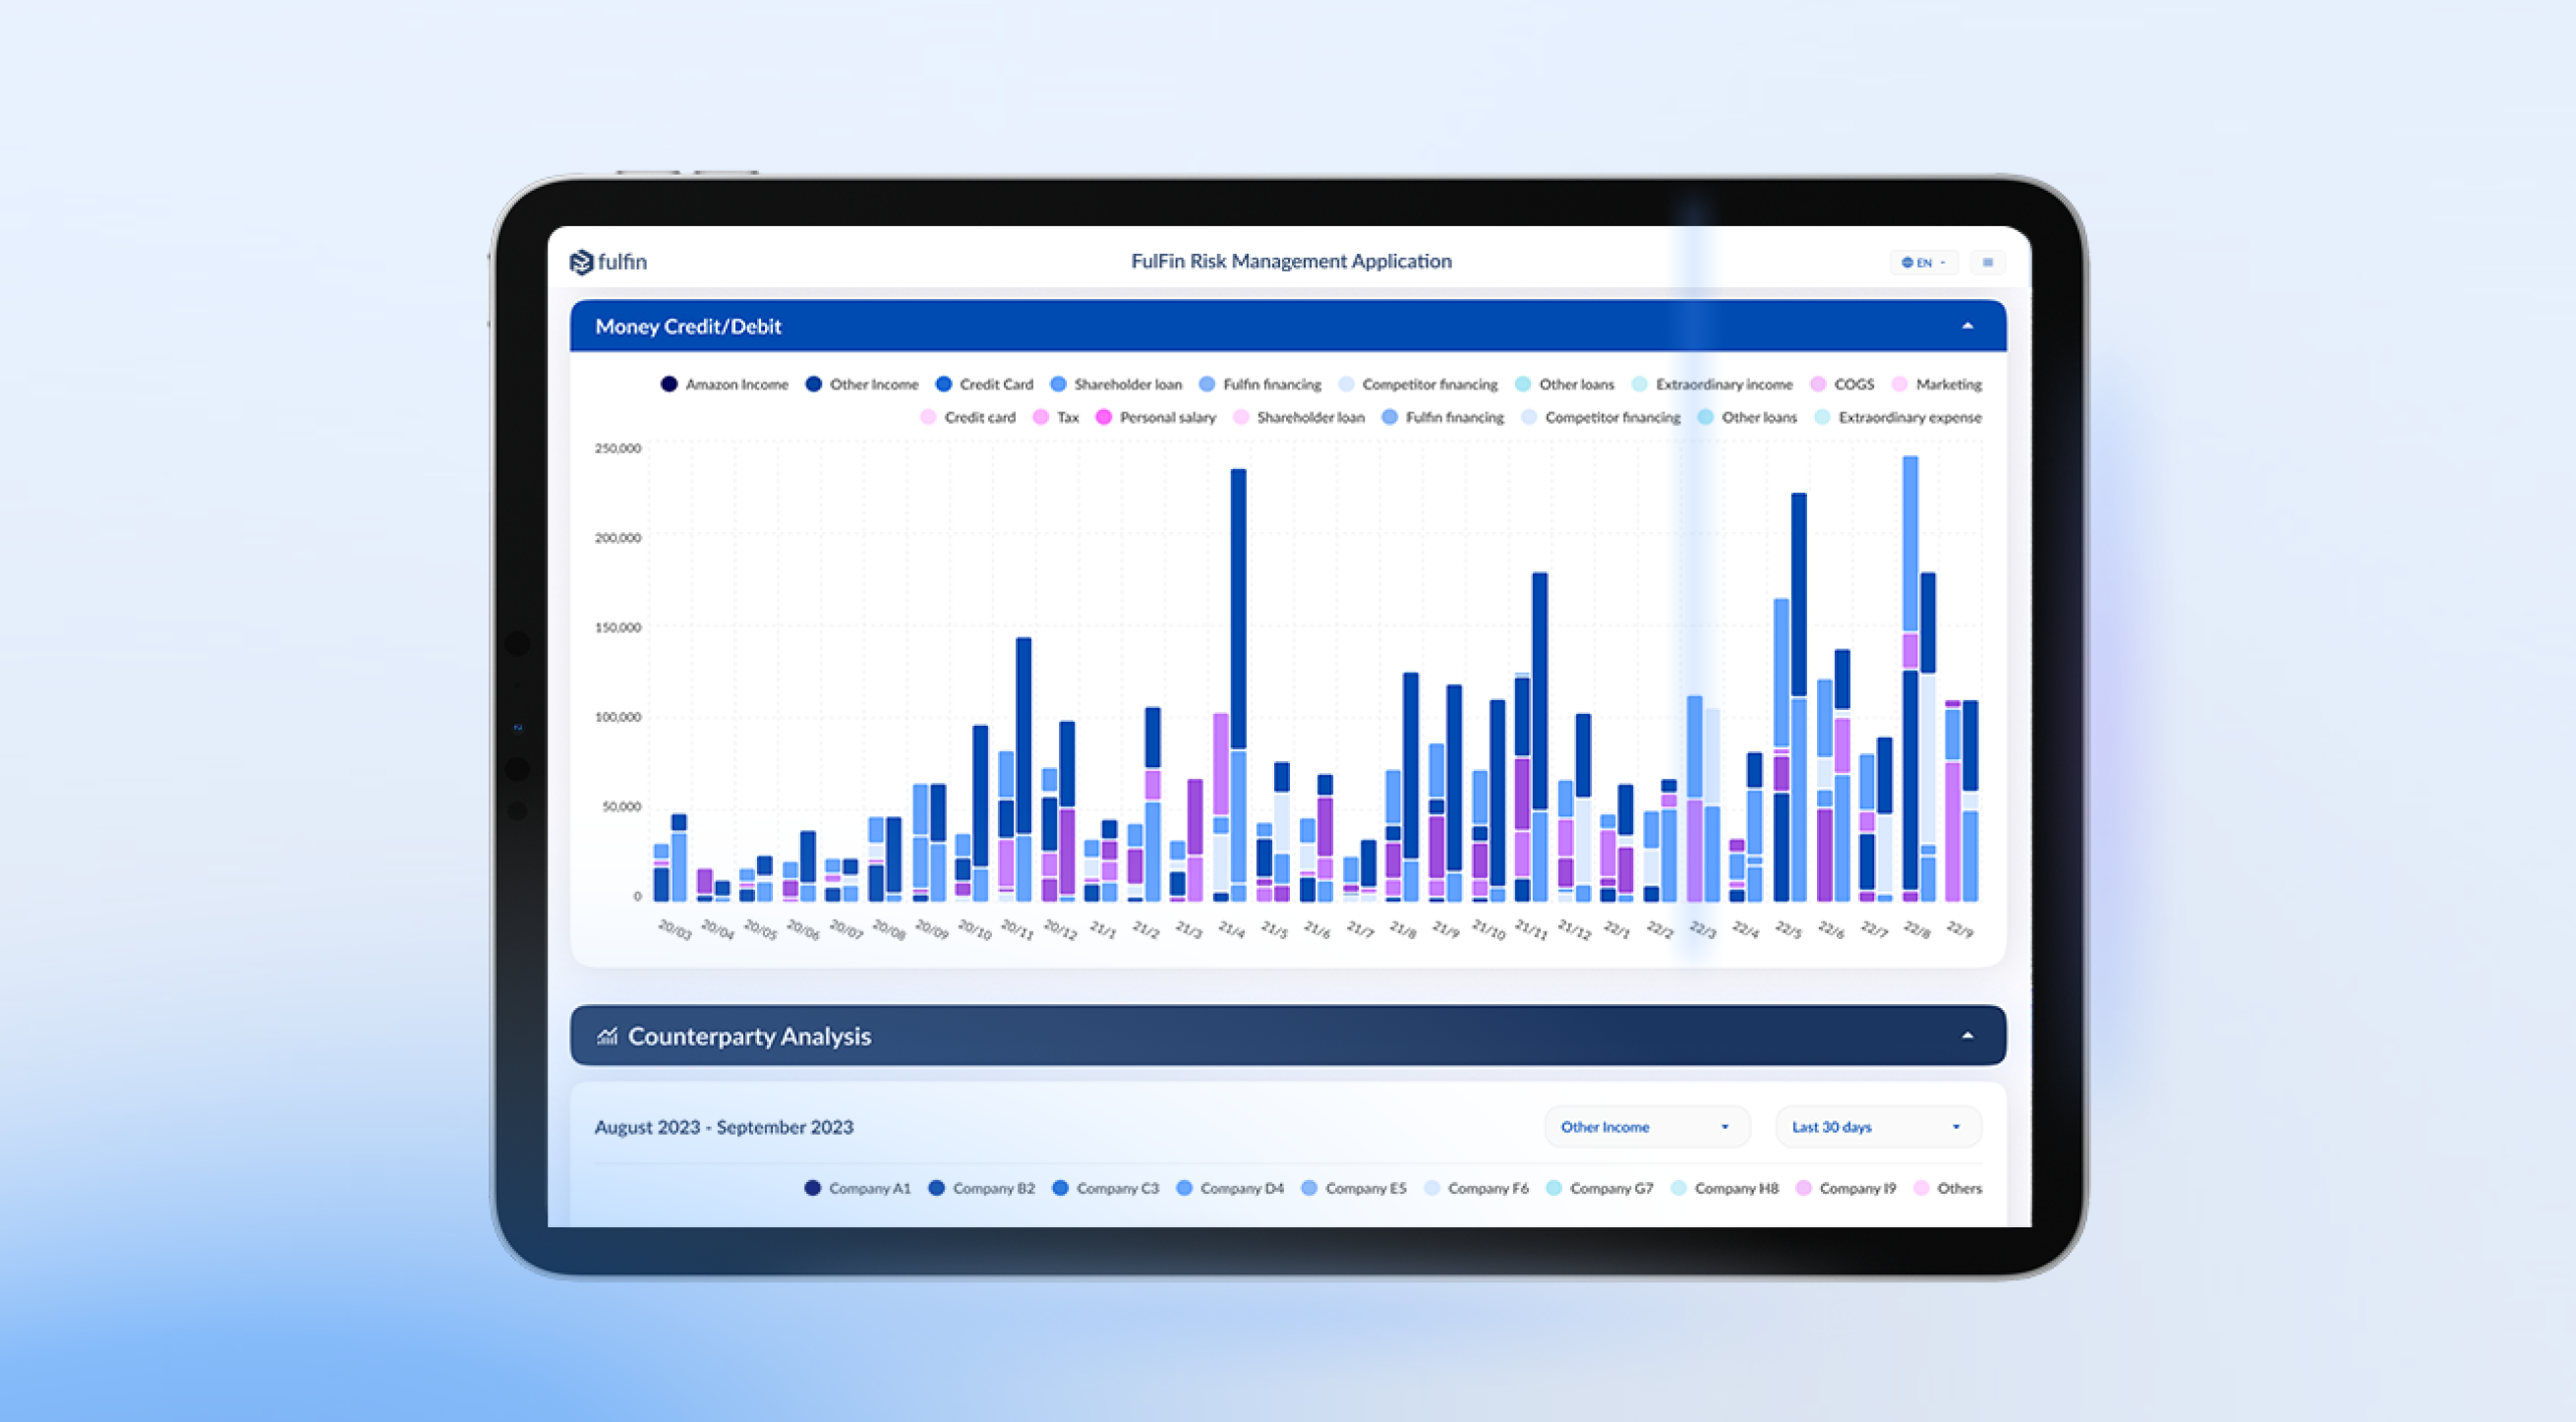
A modular web dashboard with a short onboarding sequence, clear information architecture, and reusable data-viz patterns. Analysts land on an Overview of key metrics, then drill into Cashflow Analytics, Income & Expenses, Timeseries, Money Credit/Debit, Counterparty Analysis, and Grouped Entities. Global controls for date ranges, filters, density, columns and export keep work fast and consistent. The experience reflects Fulfin’s promise of fast, flexible, technology-enabled financing for German businesses, powered by Fulfin-Tech and a partner network.

(SERVICES RENDERED)

UX research and workflows

02

Information architecture

03

Wireframes and prototypes

04

UI design and design system

05

Data-visualisation patterns

06

Onboarding and microcopy

07

Dev handoff and documentation

Colour Palette
Graph
Fulfin Logo

Opportunity

Fulfin needed a single place where credit and risk teams could see the story of a business at a glance, then move into deeper analysis without losing context. The tool had to support fast reviews, reduce manual spreadsheet work, and give a clear trail from headline metrics to transaction-level signals. It also needed a calm onboarding that selects the right company, sets expectations and shows progress while the system loads data.

UI UX Designing
Professional man
UI UX Designing
UI UX Designing

Outcome

- A calm, three-step onboarding that selects the right entity and shows reliable loading feedback.

- A dashboard made for risk work, with a clear path from top-level health to transaction patterns.

- Reusable data-viz and table components that shift easily across sectors and financing products as Fulfin expands.

- A system that supports Fulfin’s positioning as a fast, technology-driven financing partner in Germany, connecting applicants to multiple financing options with speed and clarity.

Close-up of the FulFin mobile dashboard interface showing navigation tabs for Overview, Cashflow Analytics, and Counterparty Analysis. Represents financial management app UI for tracking business performance and risk insights.
Graph
Budget Chart
Graph
Designing with Dot & Grid
Designing palette

Start A Project

Let’s get to know each other. Share a few details to help us understand where you’re coming from

UI UX Designing
Thank you! Your submission has been received!
Oops! Something went wrong while submitting the form.
dot and grid wordmark